
Top 10 Fun Discord Bots
Are you looking to spice up your Discord server with some fun and engaging bots? Do you want to create an environment that keeps your members…

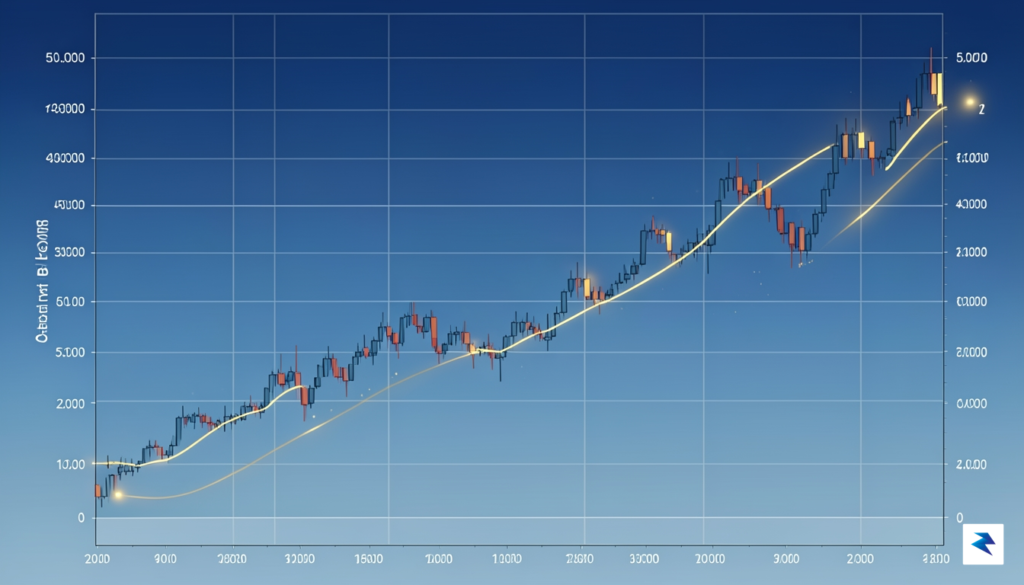
To truly grasp the long-term trajectory of Bitcoin, one must move beyond the standard linear charts that dominate mainstream financial news. While conventional assets often grow at steady, predictable rates, Bitcoin exhibits a unique behavior defined by the power law—a mathematical relationship where a change in one quantity results in a proportional change in another. Unlike linear growth, which suggests price increases by a fixed dollar amount over time, Bitcoin’s power law model accounts for the exponential, compounding nature of a nascent technology maturing into a global monetary layer. By mapping price against time on a logarithmic scale, the chaotic volatility of individual market cycles begins to smooth out, revealing a remarkably consistent corridor of growth that has persisted for nearly a decade.
The distinction between linear and logarithmic growth is critical for investors who might otherwise be spooked by Bitcoin’s dramatic price swings. A linear chart forces the eye to focus on the most recent, large-magnitude dollar movements, which often leads to emotional decision-making during periods of high volatility. In contrast, the logarithmic power law model acknowledges that a move from $10,000 to $20,000 is mathematically equivalent in percentage terms to a move from $50,000 to $100,000. By visualizing this growth through a power law lens, we can see that Bitcoin is not simply gambling on bubbles; rather, it is following a structural trend line that correlates the asset’s increasing scarcity and adoption with a predictable, long-term floor.
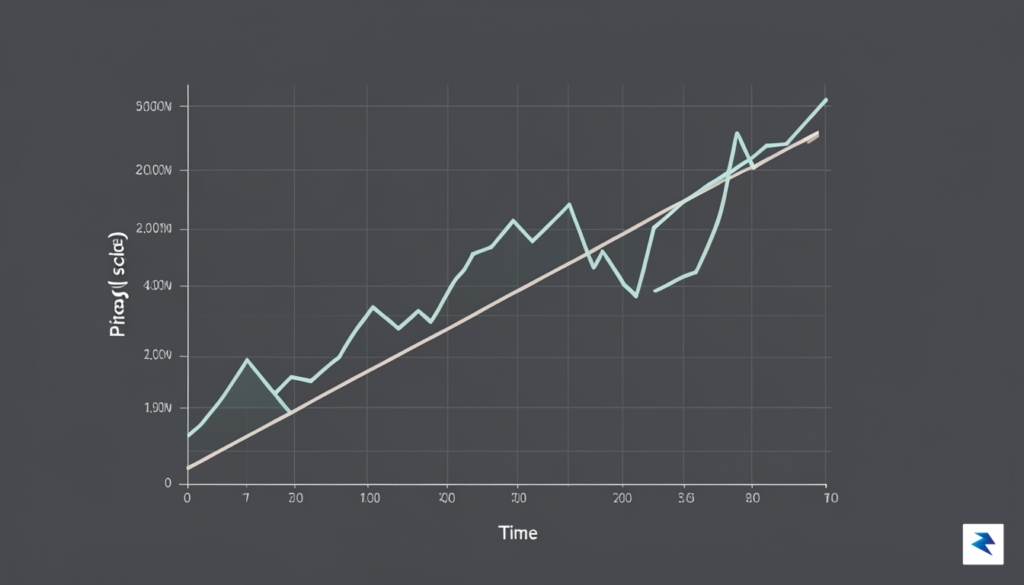
The power law support line acts as the “gravitational pull” of Bitcoin’s valuation, helping investors distinguish between temporary market noise and the underlying fundamental growth of the network.
Why should investors prioritize this baseline over popular short-term indicators like the 200-day moving average? While moving averages are useful for identifying momentum shifts within a single year, they are inherently lagging indicators that fail to capture the multi-year macro context. The power law support line tracked since 2015 provides a much more stable framework, effectively acting as the asset’s structural foundation. This baseline has remained resilient through the massive drawdowns of 2018, the COVID-19 liquidity crisis of 2020, and the deleveraging events of 2022. Because this line has held with such high fidelity across various macroeconomic environments, it serves as a powerful signal for long-term holders, suggesting that when price approaches this floor, the asset is arguably at its most attractive valuation relative to its historical growth trajectory.
Ultimately, this mathematical framework provides a level of objectivity that is often missing from crypto-asset analysis. By focusing on the power law, investors can view the inevitable “crypto winters” not as existential threats to the asset’s viability, but as predictable regressions toward a long-term mean. As Bitcoin nears this historical support level once again, the power law model provides a clear, data-driven perspective on what constitutes a “fair” entry point for those looking to build a position with a multi-year horizon in mind.

In the often-turbulent world of digital assets, where headlines are frequently driven by extreme volatility and speculative fervor, the analytical framework employed by Jurien Timmer, Director of Global Macro at Fidelity, serves as a vital anchor. Rather than succumbing to the short-term noise that dominates social media discourse, Timmer relies on rigorous quantitative modeling to interpret Bitcoin’s long-term trajectory. His approach prioritizes macro indicators and historical data points, effectively stripping away the emotional impulses that often cloud retail sentiment. By focusing on fundamental technical structures, Timmer provides institutional-grade clarity that helps investors differentiate between temporary market hiccups and genuine shifts in asset valuation.
The most compelling aspect of this perspective is the focus on the power law support line, a mathematical construct that has traced Bitcoin’s growth since as early as 2015. This specific trendline represents more than just a simple geometric line on a chart; it acts as a critical psychological and economic threshold that has historically defined Bitcoin’s maturation. When an institution like Fidelity highlights such a metric, it signals to the broader financial world that Bitcoin is increasingly being evaluated through the same lens as traditional commodities and macro-sensitive assets. This institutional validation is crucial, as it suggests that the asset’s price action is governed by discernible patterns rather than purely arbitrary market movements.
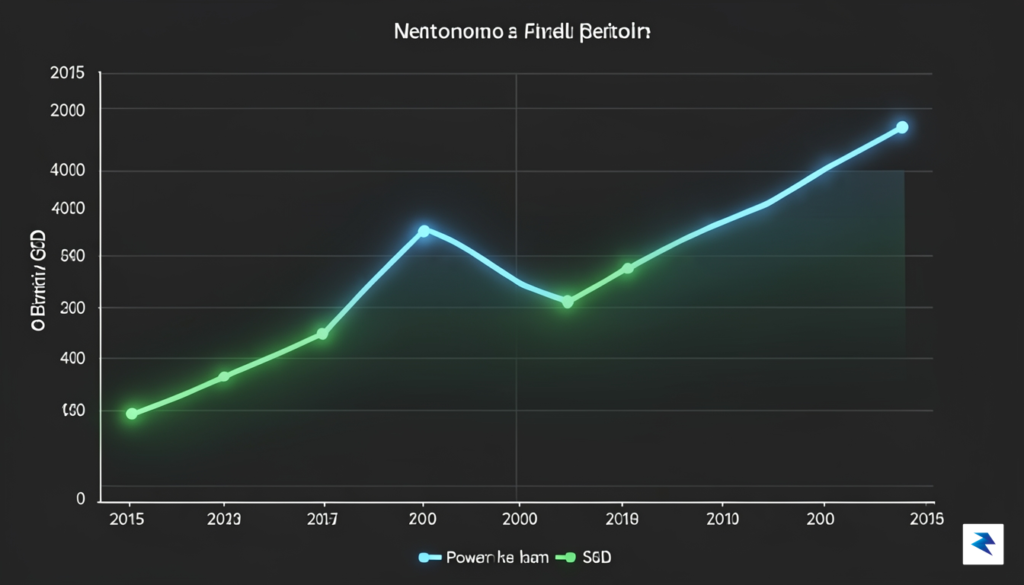
By adhering to long-term power law models, investors can better understand Bitcoin not as a speculative bubble, but as an evolving asset class that follows predictable, albeit volatile, growth patterns.
For market participants, understanding this support level is essential for maintaining a balanced outlook during periods of downturn. When price action approaches this long-standing floor, it often triggers a strategic reassessment among institutional players who view these levels as potential zones of value accumulation. By anchoring expectations to this power law, Timmer’s analysis provides a reality check that prevents investors from reacting impulsively to sharp, localized drops. Ultimately, the significance of this model lies in its ability to quantify Bitcoin’s resilience over a decade, reinforcing the narrative that despite significant regulatory and macroeconomic headwinds, the underlying demand structure for the digital asset remains robust and tethered to a long-term, upward-sloping trend.
This disciplined focus on structural integrity offers a much-needed counterweight to the “hype cycle” that typically surrounds crypto markets. As Bitcoin continues to integrate into the global financial architecture, the utility of such models will likely expand, serving as a primary tool for portfolio managers tasked with managing risk exposure in a new asset class. By mapping current market cycles against a decade of data, the analysis reminds us that Bitcoin’s history is a testament to durability; the power law is not merely a prediction of price, but a reflection of the network’s persistent adoption and the enduring confidence of long-term holders.


In the lexicon of market participants, an “accumulation zone” represents a period where the prevailing sentiment is one of patient acquisition rather than frantic speculation. Unlike distribution phases, where seasoned investors offload their holdings to late-stage buyers during periods of hype, accumulation is characterized by a “stealth” mentality. During these phases, the asset’s price often moves sideways or undergoes slow, grinding volatility, which serves to shake out impatient traders and those driven by short-term gains. For the long-term holder, these zones are not viewed as stagnant traps, but rather as distinct windows of value where the price sits comfortably above critical, long-term support levels.
Institutional players are particularly fond of these environments because they require deep liquidity to build meaningful positions without causing significant price slippage. By purchasing assets near historically significant support lines—such as the power law model tracked by firms like Fidelity—institutions can establish large cost bases that are protected by long-term technical floors. This institutional appetite for stability is a stark contrast to the retail gambler who seeks the adrenaline of parabolic price action. When the “smart money” enters these zones, they are essentially signaling a belief that the asset’s fundamental value far exceeds its current market price, effectively putting a bottom in place through consistent, methodical buying.
Accumulation is the process of moving assets from weak hands to strong hands. It is the art of buying when others are bored, fearful, or distracted, ensuring that your entry price is supported by long-term structural trends rather than fleeting market noise.
For the individual investor, applying this logic requires a shift in psychological perspective. Instead of checking portfolio balances daily or reacting to the latest headline, successful accumulation involves viewing Bitcoin as a long-term store of value that should be acquired systematically. By focusing on support levels that have held since 2015, retail investors can mirror the institutional strategy of “buying the floor” without overextending their capital. This does not mean gambling on a single bottom, but rather deploying capital in smaller, consistent increments when the asset touches these significant technical markers. By maintaining a disciplined approach—only purchasing when the price aligns with these broader historical trends—investors can avoid the common pitfalls of emotional trading and build a resilient position that stands to benefit from the asset’s long-term trajectory.

While the structural floor provided by the long-term power law support line offers a compelling safety net for long-term investors, technical support alone is rarely sufficient to ignite a fresh, parabolic bull run. For traders and market participants, the current environment feels remarkably stagnant, characterized by a persistent “sideways” drift that tests the resolve of even the most seasoned bulls. This phase of low volatility is notoriously frustrating because it lacks the clear directional conviction that fuels high-volume trading, often leaving the market in a state of suspended animation. Without a fundamental spark to challenge the status quo, price action tends to grind within a narrow range, leading to a slow erosion of interest from retail participants who thrive on rapid price appreciation.

The market is currently searching for a primary catalyst to shift this momentum, and the list of potential triggers is as broad as it is impactful. At the forefront of this search are shifting macroeconomic conditions, specifically the potential for sustained interest rate easing cycles that could weaken the dollar and increase the liquidity profile of risk-on assets. Simultaneously, the industry is closely monitoring the next wave of institutional adoption, looking for signs that major pension funds, sovereign wealth funds, or corporate treasuries will commit capital beyond initial speculative allocations. Regulatory clarity remains another significant hurdle; positive legislative developments in major financial hubs could provide the legal certainty required to bring a new class of institutional investors into the fold.
Technical floors provide the safety, but fundamental catalysts provide the fuel. A market supported by math still requires a narrative to drive the price discovery process.
Ultimately, the relationship between this prolonged period of low volatility and an eventual breakout is almost mechanical. Markets rarely stay dormant indefinitely; the compression of price action typically creates a “coiled spring” effect where the longer the consolidation lasts, the more explosive the eventual move tends to be. Whether the market decides to confirm the power law support line with a decisive bounce or experiences a temporary breakdown that triggers a final liquidity flush, the current stagnation is merely a prelude. Investors must recognize that while the power law provides a historical blueprint for value, the timing of the next cycle will depend entirely on when the next major macro or fundamental narrative begins to dominate the headlines.

When observing Bitcoin through the lens of a power law model, the immediate price fluctuations that dominate daily headlines often appear as mere noise against the backdrop of a much larger structural trajectory. For the long-term investor, the temptation to react to every dip or rally can be the greatest obstacle to wealth preservation. Instead of fixating on short-term volatility, it is more productive to view the current market positioning as a test of conviction. By aligning your expectations with historical support levels—such as the trend line tracked since 2015—you can shift your perspective from reactive trading to proactive asset accumulation, recognizing that periods of consolidation are often the building blocks for future appreciation.
Effective risk management remains the bedrock of any sustainable strategy in the digital asset space. Speculation thrives on the illusion of quick gains, but the power law model suggests that Bitcoin’s value is driven by fundamental adoption cycles rather than speculative fervor. Investors should prioritize position sizing that accounts for the inherent volatility of the asset class, ensuring that their exposure is balanced against their overall financial health. Rather than attempting to time the market perfectly—an endeavor that frequently leads to emotional exhaustion and capital erosion—adopting a disciplined dollar-cost averaging approach can help mitigate the impact of price swings while keeping you anchored to the underlying trend.
The primary goal of a long-term strategy is not to predict the next price movement, but to ensure you remain positioned to benefit from the asset’s structural growth when the market eventually matures.

Ultimately, the most successful market participants are those who possess the patience to endure macro-economic cycles. Digital assets do not exist in a vacuum; they are influenced by global liquidity, regulatory shifts, and broader economic sentiment. While these external pressures can cause the price to deviate from historical models in the short term, the long-term trend remains the most reliable compass. Maintaining a rational outlook during periods of uncertainty requires the discipline to distinguish between temporary market turbulence and a fundamental change in the asset’s thesis. By keeping your eyes on the long-term horizon and trusting in the historical support structures that have defined Bitcoin’s evolution, you can navigate even the most volatile cycles with a sense of clarity and purpose.
You must be logged in to post a comment.