Decoding the Dot Plot: What It Actually Means
Often highlighted in financial news and eagerly scrutinized by market participants, the Federal Reserve’s “dot plot” has become one of the most visible, yet frequently misunderstood, elements of its communication toolkit. Officially part of the quarterly Summary of Economic Projections (SEP), this chart visually represents where each Federal Open Market Committee (FOMC) participant believes the federal funds rate should be at the end of the current year, the next two calendar years, and over the longer run. While its prominence might suggest a definitive policy roadmap, understanding its true nature is crucial for anyone trying to decipher the Fed’s potential future actions.
The fundamental clarification to make is this: the dots are not a collective forecast from the FOMC. Instead, each dot on the plot signifies an anonymous individual’s projection for the appropriate federal funds rate. These individual views come from all members of the Federal Reserve Board of Governors and the presidents of the twelve Federal Reserve Banks, regardless of whether they are currently voting members of the FOMC. This means the chart aggregates up to 19 distinct opinions, offering a diverse spectrum of thought rather than a unified, consensus-driven committee outlook. Each participant arrives at their projection based on their own assessment of economic conditions, inflation outlook, and employment prospects.
It’s vital to distinguish the dot plot from the official FOMC policy statement. The policy statement, released after each meeting, outlines the committee’s collective decision on monetary policy, including any changes to the federal funds rate target. This is the binding agreement that guides the Fed’s immediate actions. In stark contrast, the dot plot is a collection of personal forecasts, reflecting what each individual believes is the optimal policy path given their current understanding of the economy. It is not a promise, nor does it commit the committee to any future course of action. Failing to recognize this distinction can lead to significant misinterpretations and unwarranted market reactions.
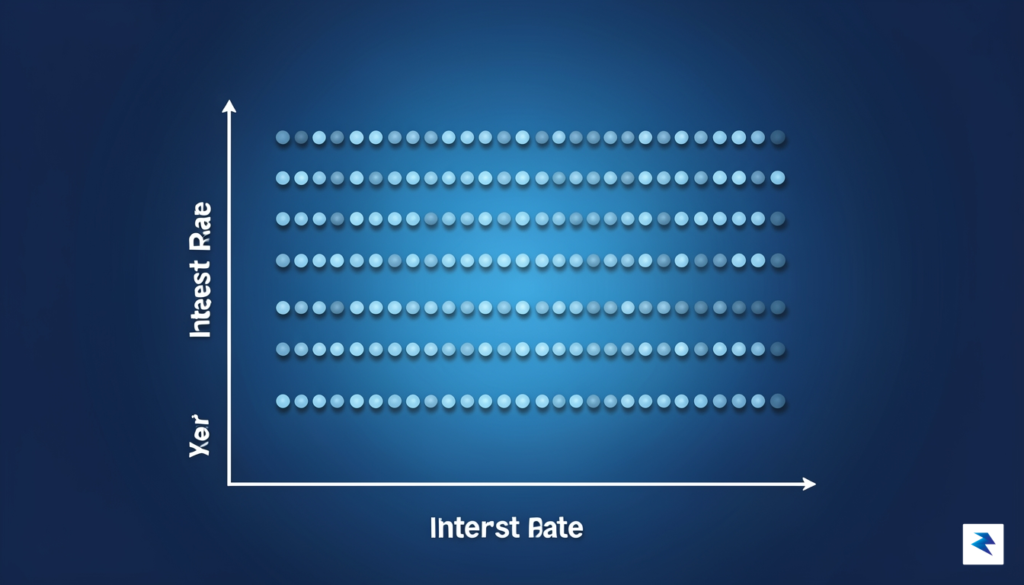
One of the most valuable insights the dot plot provides comes not from the median dot, which is often quoted, but from the spread of the dots. A tightly clustered set of dots suggests a relatively high degree of consensus among Fed officials regarding the future path of interest rates and the economic outlook. Conversely, a wide dispersion of dots indicates considerable disagreement or uncertainty about where rates should be headed. This spread is a powerful indicator of internal debate within the Fed, signaling potential shifts in policy perspectives or a
The Economic Projection Materials (EPM) Explained

While the federal funds rate usually dominates the financial news cycle, focusing solely on interest rate targets is akin to watching a movie with the sound turned off. The real narrative of the Federal Reserve’s strategy is woven into the Economic Projection Materials (EPM), a comprehensive document that acts as a roadmap for the central bank’s collective view of the American economy. By examining forecasts for Gross Domestic Product (GDP) growth, the unemployment rate, and Personal Consumption Expenditures (PCE) inflation, you gain access to the same dashboard the policymakers use to navigate the complex trade-offs between price stability and maximum employment.
The EPM provides a multi-year trajectory for these key variables, offering a granular look at how the committee expects the economy to evolve. GDP projections serve as a proxy for overall economic health, signaling whether the Fed anticipates a period of robust expansion or a cooling-off phase. Simultaneously, the PCE inflation forecasts reveal the committee’s confidence in hitting its 2% target, while unemployment figures illustrate the expected tightness of the labor market. Together, these metrics act as the fundamental pillars of the Fed’s “dual mandate.” When you see a change in a GDP forecast, it almost always provides the necessary context for why the committee might be leaning toward a more hawkish or dovish stance on interest rates.
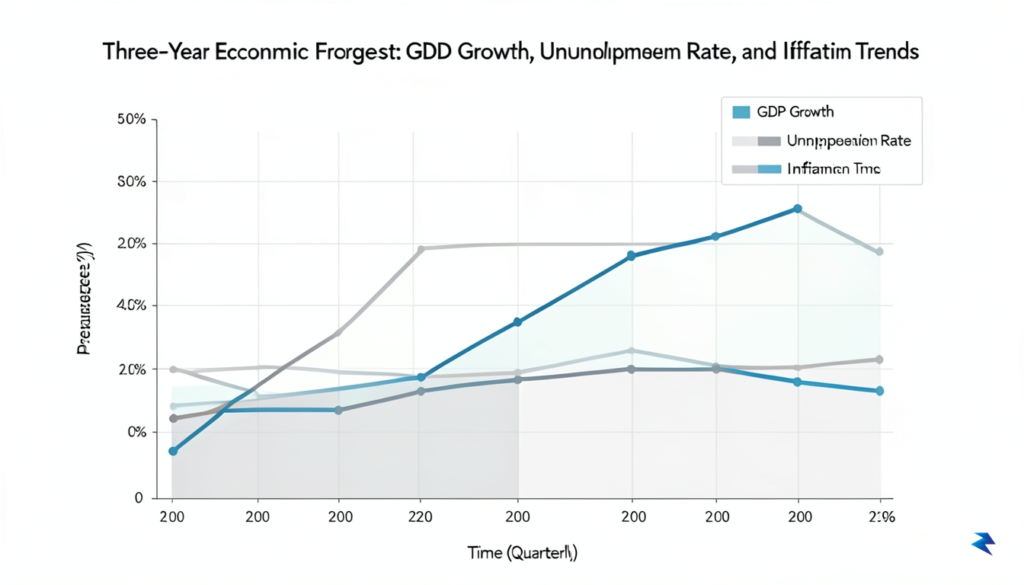
Perhaps the most overlooked, yet critical, component of these materials is the “longer-run” estimate. While quarterly projections reflect the immediate reaction to current economic headwinds, the longer-run figures represent the committee’s collective belief about the economy’s sustainable, neutral state—often referred to as the r-star or the long-term equilibrium. These numbers are vital because they anchor expectations; if the long-term projection for interest rates or inflation shifts upward, it suggests that the Fed believes the underlying structure of the economy has fundamentally changed. Ignoring these long-term markers means missing the structural shifts that dictate the ceiling and floor for future monetary policy.
The interplay between these variables is not accidental; it is a delicate balancing act where every adjustment in a growth forecast necessitates a corresponding recalibration of the interest rate path to ensure the economy remains on a path toward stable, sustainable growth.
Ultimately, these projections are deeply interconnected. For instance, if the committee raises its unemployment forecasts while simultaneously lowering its GDP growth expectations, they are signaling a deliberate cooling of the economy to combat persistent inflation. By learning to synthesize these variables rather than isolating them, you can move past the surface-level headlines and begin to anticipate the Fed’s next move before the official announcement is even made. Viewing the EPM as a holistic system allows you to understand the “why” behind the policy, transforming you from a passive observer into an informed participant in the economic conversation.
Why Market Sentiment Often Diverges from Fed Guidance

The intricate dance between the Federal Reserve’s official pronouncements and the ever-shifting tides of market sentiment is a cornerstone of financial market dynamics. Despite the Fed’s earnest efforts to communicate its policy intentions and economic outlook transparently, Wall Street frequently develops its own narrative, often diverging significantly from the central bank’s guidance. This friction point is a primary driver of market volatility, as investors continually attempt to anticipate or even bet against the Fed’s stated path, leading to periods where the market perceives the Fed as either unduly hawkish (too aggressive in tightening) or overly dovish (too slow in tightening).
At the heart of this tension lies the fundamental difference between “market pricing” and “Fed signaling.” The Federal Reserve, through its statements, speeches, and the highly scrutinized dot plot, provides explicit forward guidance on its projected interest rate path and economic conditions. This is its official signal. However, market pricing is a much more complex beast; it represents the collective wisdom (or sometimes irrational exuberance) of millions of participants who are constantly discounting future events into current asset prices. Investors aren’t merely passive recipients of Fed signals; they are active interpreters, prognosticators, and risk-takers who factor in countless variables, including their own economic models, geopolitical events, and even perceived market psychology, often forming expectations that deviate sharply from the Fed’s official line.
Furthermore, the interplay of financial conditions plays a critical role in exacerbating or alleviating these divergences. The Fed’s policy actions are designed to influence broader financial conditions – things like bond yields, equity valuations, and the availability of credit. Yet, market participants themselves, through their trading and investment decisions, also shape these very conditions. For instance, if the Fed signals a hawkish stance, but the market interprets upcoming economic data as weakening, investors might aggressively buy bonds, pushing yields down and effectively loosening financial conditions even as the Fed attempts to tighten them. This feedback loop can create a tug-of-war, where market reactions sometimes counteract or amplify the Fed’s intended policy transmission, leading to further discrepancies between official guidance and real-world market behavior.
Another significant factor contributing to this divergence is the distinct way both the Fed and market participants process and react to economic data. While both rely on a wide array of indicators, their methodologies, time horizons, and risk assessments can vary considerably. The market, driven by profit motives and often influenced by high-frequency trading and algorithmic models, tends to react almost instantaneously to new data releases, frequently projecting short-term trends or anticipating shifts before they become evident in broader statistical aggregates. The Federal Reserve, conversely, typically adopts a more measured, data-dependent approach, focusing on underlying trends, longer-term forecasts, and the potential lags associated with monetary policy, ensuring that its policy shifts are grounded in robust, sustained evidence rather than fleeting market sentiment or isolated data points.
Consequently, when the market “bets against the Fed,” it’s not necessarily a sign of disrespect or a direct challenge to authority. Instead, it often reflects a sophisticated, albeit sometimes speculative, alternative economic forecast held by a significant portion of investors. For example, if the Fed projects a steady path of rate hikes, but the market sees compelling evidence of an impending economic slowdown or a faster-than-expected decline in inflation, it might price in fewer hikes or even anticipate future rate cuts. This forward-looking speculation can cause bond yields to fall, equity markets to rally, or currencies to fluctuate in ways that seem to contradict the Fed’s explicit guidance, creating a powerful friction point that policymakers must acknowledge and often react to in their subsequent communications.
Ultimately, a divergence between market sentiment and Federal Reserve guidance isn’t inherently a sign of policy failure or miscommunication. Rather, it underscores the dynamic and often unpredictable nature of a free-market economy. The market’s collective intelligence, even when misguided, serves as a real-time sounding board, offering a continuous stream of feedback that the Fed can observe, analyze, and incorporate into its own complex decision-making process. This ongoing tension highlights the intricate and often delicate balance between central bank credibility, market expectations, and the ultimate goal of achieving stable prices and maximum sustainable employment.
The Risk of Over-Analyzing Short-Term Volatility

In today’s hyper-connected financial landscape, where news cycles run 24/7 and market updates ping our devices constantly, it’s incredibly easy to fall into the trap of overreacting to every minor tremor in the economic data. The Federal Reserve’s pronouncements, particularly their projections on interest rates and economic growth, often become the subject of intense scrutiny, with pundits dissecting every word and every subtle shift. This constant barrage can make it challenging to distinguish between genuine ‘signal’ – the fundamental, long-term trends and policy intentions – and mere ‘noise’ – the daily fluctuations, sensational headlines, and speculative chatter that often dominate short-term reporting. For those aiming to understand the economy and make informed decisions, learning to filter out this noise is paramount to maintaining a clear perspective and avoiding impulsive actions.
A crucial element often overlooked by those fixated on minor changes in Fed projections is the very nature of central bank policy: it is inherently data-dependent. The Federal Open Market Committee (FOMC) does not operate with a rigid, pre-set plan stretching years into the future; rather, their outlook and potential actions are continuously re-evaluated based on the freshest economic reports. A surprisingly strong employment report, an unexpected surge in inflation, or a sudden shift in global economic conditions can, within weeks, significantly alter the Fed’s perspective and, consequently, their future policy trajectory. Therefore, viewing any given set of projections as an unalterable forecast is a fundamental misunderstanding; they are merely the committee’s best assessment at a specific point in time, subject to rapid revision as new information emerges.
To navigate this dynamic environment effectively and avoid emotional trading, cultivating a discerning approach to financial news is essential. Instead of fixating on the immediate, often exaggerated reactions to every data release or slight adjustment in a Fed projection, focus on understanding the underlying reasons for the central bank’s stance and the broader economic narrative. Seek out analyses that delve into the structural forces at play, rather than just reporting the headline numbers. Develop a long-term investment strategy that is robust enough to withstand short-term volatility and isn’t predicated on predicting every twist and turn of monetary policy. By prioritizing deep understanding over instantaneous reactions, you can better align your decisions with genuine economic signals, protecting yourself from the emotional pitfalls of the constant news cycle and fostering a more disciplined approach to your financial future.
Translating Central Bank Speak Into Personal Financial Strategy

Understanding the Federal Reserve’s future interest rate path, often gleaned from their Summary of Economic Projections (SEP) or “dot plot,” is not merely an academic exercise for economists; it’s a critical tool for shaping your personal financial strategy. These projections offer a glimpse into the central bank’s expectations for the economy, directly influencing the borrowing and lending rates that permeate every corner of your financial life. By learning to interpret these signals, you empower yourself to make proactive decisions, rather than reacting to market shifts after they’ve already impacted your wallet. Ultimately, the goal is to translate complex monetary policy into tangible steps that safeguard and grow your personal wealth.
When the Fed signals an intention to raise interest rates, it typically translates to higher yields on savings accounts, Certificates of Deposit (CDs), and money market accounts. This environment rewards savers, making it an opportune time to maximize returns on your cash holdings or consider locking in higher rates with fixed-income instruments like long-term CDs before rates potentially decline again. Conversely, a projected rate cut might suggest it’s time to re-evaluate your cash strategy, perhaps by considering investments with higher growth potential if your emergency fund is sufficiently robust. Moreover, rising rates can sometimes make bonds more attractive relative to stocks, influencing your broader portfolio allocation decisions.
For homeowners and prospective buyers, Fed rate projections are profoundly significant. When the Fed anticipates raising rates, mortgage rates generally follow suit, making new loans more expensive. If you’re considering purchasing a home or refinancing an existing mortgage, acting before anticipated rate hikes could save you tens of thousands of dollars over the life of the loan. Conversely, a future outlook for lower rates might suggest holding off on refinancing or locking in a new mortgage until rates become more favorable. Those with adjustable-rate mortgages (ARMs) are particularly exposed,