Alibaba’s AI Success: Why Popularity Doesn’t Always Mean Profit
The Rise of Qwen: Alibaba’s Global AI Ambition In the rapidly evolving landscape of generative artificial intelligence, Alibaba has vaulted…

When you update a DNS record, you are essentially whispering a secret to the internet, hoping that every recursive resolver across the globe will eventually hear and repeat it. However, the internet is not a single, unified machine; it is a sprawling, decentralized collection of networks, each governed by its own policies and caching behaviors. The primary mechanism controlling this transition is the Time to Live (TTL) value, which instructs resolvers how long they should hold onto a record before checking for an update. Because these values vary wildly—ranging from a few seconds to several days—changes do not ripple across the digital landscape instantaneously, leading to a fragmented period where different users see entirely different versions of your service.
This reality often creates a frustrating “it works for me, but not for them” scenario that haunts developers and system administrators alike. You might verify your changes using a local dig or nslookup command and see the correct IP address reflected, leading you to believe the deployment was a success. Yet, simultaneously, your users in another country might be hitting a cached, stale record that routes them to an old server or a dead endpoint. Without a bird’s-eye view of how these changes are percolating through various global nodes, troubleshooting becomes a game of blind guessing, often resulting in prolonged downtime or unnecessary service interruptions.

Moving beyond simple, point-in-time diagnostic commands is essential for modern infrastructure management. While traditional tools allow you to check a specific server’s status, they fail to provide the geographical context required to understand the global impact of a DNS update. To effectively maintain high availability, administrators need visibility that spans multiple continents and ISP networks simultaneously. This need has paved the way for specialized terminal-based monitoring solutions that bridge the gap between abstract record changes and tangible, real-world propagation status.
The strength of a global service is only as good as the speed at which its users can resolve its location. True DNS health is measured not by the accuracy of the record on your own machine, but by the uniformity of that information across the entire global cache ecosystem.
By leveraging tools that provide this level of visibility, you transform the “black box” of DNS propagation into a transparent, observable process. Instead of waiting for support tickets to roll in from users who cannot access your site, you can proactively track the propagation wave as it spreads. This visibility allows you to make informed decisions about TTL strategies, anticipate regional latency issues, and verify that your infrastructure transitions are complete before declaring a deployment successful.

For systems administrators and developers, the traditional method of verifying DNS propagation often involves cycling through various web-based lookup tools, which can be cumbersome, slow, and laden with intrusive advertisements. DNSGlobe fundamentally disrupts this workflow by bringing global DNS monitoring directly into your terminal environment. By leveraging a Terminal User Interface (TUI), this tool provides a highly efficient, lightweight alternative that eliminates the need for browser overhead. Instead of waiting for pages to render or navigating cluttered interfaces, you gain immediate, raw access to propagation data, allowing you to monitor status updates across hundreds of global nodes simultaneously with minimal latency.
The primary advantage of shifting to a CLI-native tool lies in its unparalleled speed and resource efficiency. Because DNSGlobe operates as a binary within your command line, it consumes a fraction of the memory and processing power that a modern web browser requires to display the same information. This makes it an ideal companion for high-pressure scenarios where you need to verify a TTL change or a record update in real-time without context switching between your terminal and a browser window. Furthermore, by stripping away the tracking scripts and external dependencies inherent in web-based checkers, DNSGlobe offers a more private, focused experience that prioritizes raw data delivery over aesthetic fluff.
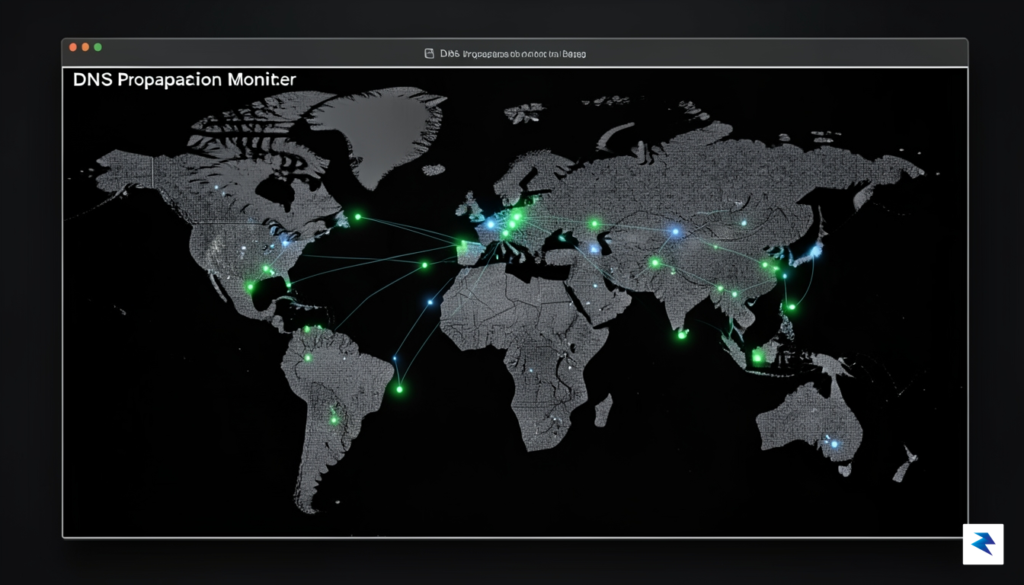
The decision to build DNSGlobe in Rust is far from a stylistic choice; it is a technical necessity for managing high-concurrency network tasks. When performing hundreds of DNS queries against geographically dispersed resolvers, the application must manage a massive volume of asynchronous network requests without succumbing to race conditions or memory leaks. Rust’s ownership model and strict memory safety guarantees ensure that DNSGlobe can handle these parallel operations with exceptional stability. This reliability is critical when you are relying on the tool to provide an accurate picture of global DNS health; a crash or a memory-related hang during a critical deployment would be unacceptable.
DNSGlobe leverages Rust’s asynchronous ecosystem to transform the chaotic process of global DNS propagation into a synchronized, high-performance visual dashboard that fits perfectly into any developer’s existing CLI workflow.
Beyond memory safety, Rust’s zero-cost abstractions allow DNSGlobe to maintain its lightweight footprint while offering sophisticated features like real-time status updates and interactive sorting. By compiling down to a single, portable binary, the tool ensures that you can deploy your monitoring stack across diverse environments—whether you are working on a local machine, a remote server, or a containerized development instance—without worrying about language runtimes or dependency hell. Ultimately, this combination of performance and portability makes DNSGlobe a formidable addition to any developer’s toolkit, turning a once-tedious verification task into a seamless, high-speed operation.

Monitoring the global propagation of DNS records presents a significant technical challenge, primarily due to the inherent latency of network communication across vast geographical distances and the sheer number of DNS resolvers worldwide. DNSGlobe tackles this complexity head-on, leveraging the power of Rust’s robust asynchronous runtime to deliver a near-instant, comprehensive snapshot of your record’s status from a global perspective. This architecture is not merely an incremental improvement; it represents a fundamental shift in how propagation checks are performed, moving from serial, often slow, inquiries to simultaneous, high-throughput data collection.
At the heart of DNSGlobe’s exceptional performance lies its utilization of asynchronous networking. Traditional applications often operate synchronously, meaning they send a request and then pause, or “block,” until a response is received before proceeding to the next task. While acceptable for localized operations, this model becomes a severe bottleneck when querying hundreds or even thousands of DNS resolvers distributed across continents. Imagine waiting for a response from a server in Australia before you can even send a request to one in Europe; the cumulative delay quickly renders the process impractical for real-time monitoring. Rust’s `async`/`await` primitives, powered by highly efficient runtimes like Tokio, allow DNSGlobe to initiate numerous DNS queries concurrently without blocking. This means it can dispatch requests to resolvers in New York, London, Tokyo, and Sydney almost simultaneously, efficiently managing the waiting periods for each response without holding up other operations.
This architectural decision to embrace asynchronous I/O is crucial for providing the “real-time” experience DNSGlobe promises. By preventing the tool from idling while awaiting network responses, it can maintain an active connection with the global DNS infrastructure, constantly fetching data. The result is an incredibly efficient system that can gather and present data from diverse locations with unparalleled speed. Furthermore, Rust’s reputation for memory safety and zero-cost abstractions ensures that this high level of concurrency doesn’t come at the expense of system resources. The underlying code is optimized to make the most of available hardware, providing a lean yet powerful engine for global DNS monitoring.
Beyond its core asynchronous engine, DNSGlobe’s design philosophy prioritizes a lightweight, CLI-first workflow. This choice is deliberate and contributes significantly to its performance benefits. Unlike resource-intensive graphical applications or browser-based tools, DNSGlobe operates directly within your terminal. This eliminates the overhead associated with rendering complex user interfaces, loading extensive JavaScript frameworks, or managing a heavy browser environment. For developers, system administrators, and anyone who prefers a command-line interface, this lean approach means faster startup times, minimal memory footprint, and a direct, unmediated interaction with the network and the data it provides. The focus is purely on efficiently querying DNS and presenting the results, without any unnecessary layers of abstraction or visual embellishment that could introduce latency.
Contrast this streamlined approach with many typical web-based DNS propagation tools. While convenient for quick, casual checks, these services often introduce multiple layers of latency and potential bottlenecks. When you use a web tool, your request first travels to their web server, which then typically makes an internal API call, which then performs the DNS queries. Finally, the results are sent back to their web server, rendered into a web page, and then transmitted back to your browser for display. Each of these steps adds processing time and network delay. Moreover, web interfaces can become bloated with design elements and client-side scripting, further impacting perceived and actual performance.
DNSGlobe sidesteps these issues entirely, offering a direct conduit to the global DNS infrastructure. Its command-line nature, combined with Rust’s async capabilities, ensures that the only significant latency you experience is the inherent network travel time to the distant resolvers themselves, providing an unvarnished, high-fidelity view of your DNS records.
This dedication to efficiency and directness means DNSGlobe doesn’t just promise speed; it delivers it by design. The combination of Rust’s powerful asynchronous primitives and a minimalist, CLI-centric architecture culminates in a tool that is not only robust and reliable but also exceptionally fast and resource-friendly, offering a truly real-time perspective on global DNS propagation that few other tools can match.


For DevOps engineers and Site Reliability Engineers (SREs), the transition from “we updated the DNS record” to “the world sees the change” is often a period of high-stakes uncertainty. DNSGlobe transforms this opaque interval into a measurable, observable process, providing the real-time visibility necessary to manage complex infrastructure transitions with confidence. By surfacing propagation data directly in the terminal, it allows SREs to integrate DNS health checks into their standard CLI-based workflows without context switching to web-based propagation tools.
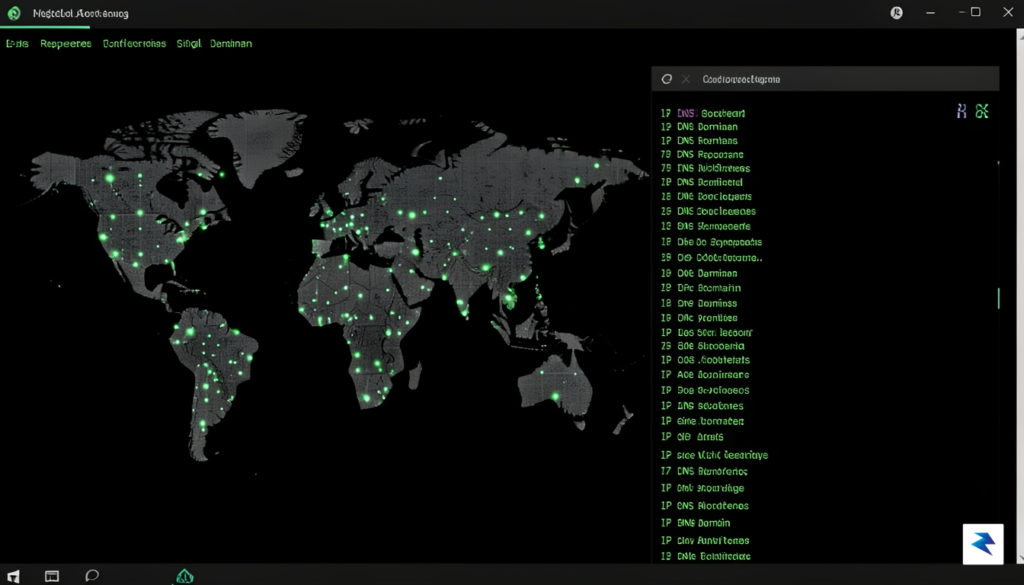
When executing a domain migration or a blue-green deployment, the primary challenge is ensuring that traffic is correctly routed to the new origin as TTL (Time-to-Live) values expire. SREs can utilize this tool to perform post-migration verification of A and AAAA records, ensuring that the global edge network is reflecting the intended target. Rather than relying on theoretical propagation times, the tool provides empirical evidence of which geographical regions have successfully updated. This insight is critical for deciding when to safely decommission legacy infrastructure, as it prevents the premature termination of services while legacy clients are still hitting old endpoints.
Beyond migrations, the tool serves as a powerful instrument for diagnosing localized outages that manifest as “it works for some, but not for others.” By monitoring specific ISPs and regional nodes, engineers can identify if a particular recursive resolver is failing to honor updated records or if a regional ISP is caching stale data beyond the defined TTL. This granularity allows SREs to distinguish between a global infrastructure failure and a localized propagation delay. When support tickets arrive from a specific geographic region, this diagnostic capability enables rapid isolation of the issue, saving precious time during an incident response scenario.
Monitoring propagation in real-time allows teams to move from reactive troubleshooting to proactive traffic management. By observing how long updates take to ripple through the global DNS ecosystem, SREs can make informed decisions about TTL tuning, ensuring that future updates are faster and more reliable.
Finally, for critical API endpoints, the speed of record updates is directly tied to the availability of the application. By continuously monitoring the global update times for these records, teams can create a baseline for their DNS provider’s performance. If the data shows that specific regions consistently lag, it may indicate a need to switch providers, adjust load balancer configurations, or implement a multi-DNS strategy to ensure consistent availability. This data-driven approach shifts the responsibility of DNS management from a “set it and forget it” task to an active component of a robust, high-availability architecture.
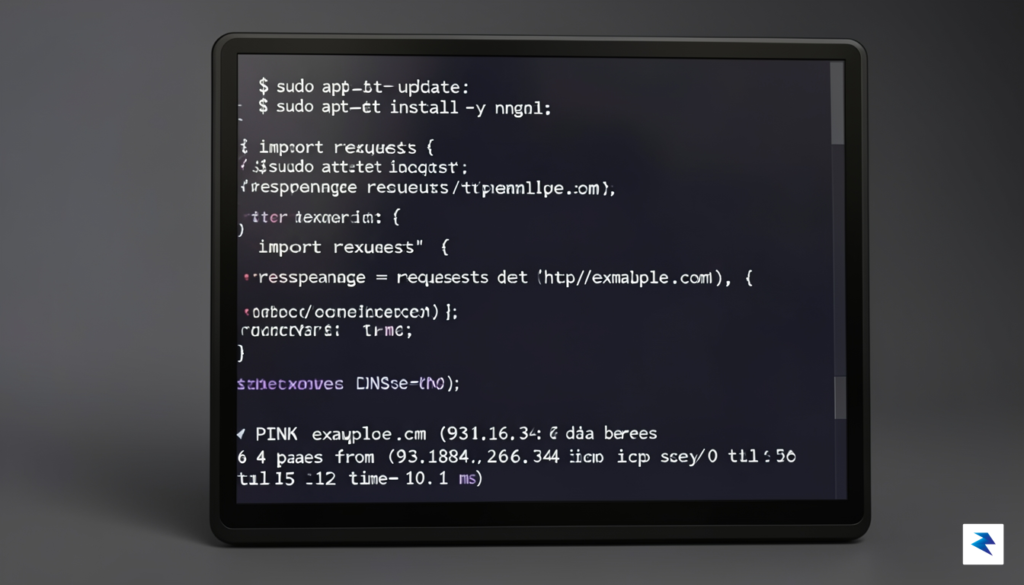
Getting DNSGlobe up and running is a streamlined process, primarily because it leverages the robust Rust ecosystem. Before you begin, ensure that you have the Rust toolchain installed on your machine, which includes cargo, the package manager used to build and distribute these tools. If you haven’t set up Rust yet, you can easily install it via rustup, the official installer, which will manage your toolchain versions automatically. Once your environment is prepared, installing the tool is as simple as executing cargo install dnsglobe in your terminal. This command fetches the latest source code, compiles the binary locally, and adds it to your system path, ensuring you are ready to monitor DNS propagation immediately after the installation finishes.
Once the binary is installed, you can launch the application by simply typing dnsglobe followed by your target domain. While the default settings provide a great out-of-the-box experience, you can customize your monitoring sessions to suit specific needs by passing flags directly through the command line. For instance, if you need to query specific nameservers or use custom resolvers instead of the system defaults, the tool provides options to override the resolution path. This flexibility is particularly useful for developers or network engineers who need to verify how a domain resolves through internal corporate DNS infrastructure versus public resolvers like Google or Cloudflare.

Understanding the TUI dashboard is straightforward, even for those new to terminal-based monitoring. The interface is designed to present complex data in a digestible format, typically splitting the screen into distinct zones. The central area usually displays a visualization of global propagation, highlighting different geographic regions where the DNS query has been successfully resolved or where it is still pending. By default, you will see a list of results indicating the IP address returned by each probe location, along with an indicator of latency or success status. If you are tracking a recent update, keep an eye on the refresh interval; this allows you to watch the propagation ripple across the globe in real-time as TTL (Time to Live) values expire and new records are cached by various regional ISPs.
Pro-tip: If you are monitoring a particularly stubborn propagation issue, keep the tool running in a dedicated terminal pane. The interface will automatically refresh, allowing you to observe the transition from old record values to the new ones as they propagate through the global DNS hierarchy.
Finally, remember that the speed at which you see updates is often dependent on the propagation delay inherent in the DNS system itself. While this utility provides a window into this process, it cannot force ISP caches to clear faster. However, by using the --verbose flag if available, or by piping the output to a log file, you can maintain a record of the propagation timeline. This is an invaluable asset when troubleshooting global outages or verifying that a critical production change has effectively reached all corners of your user base.
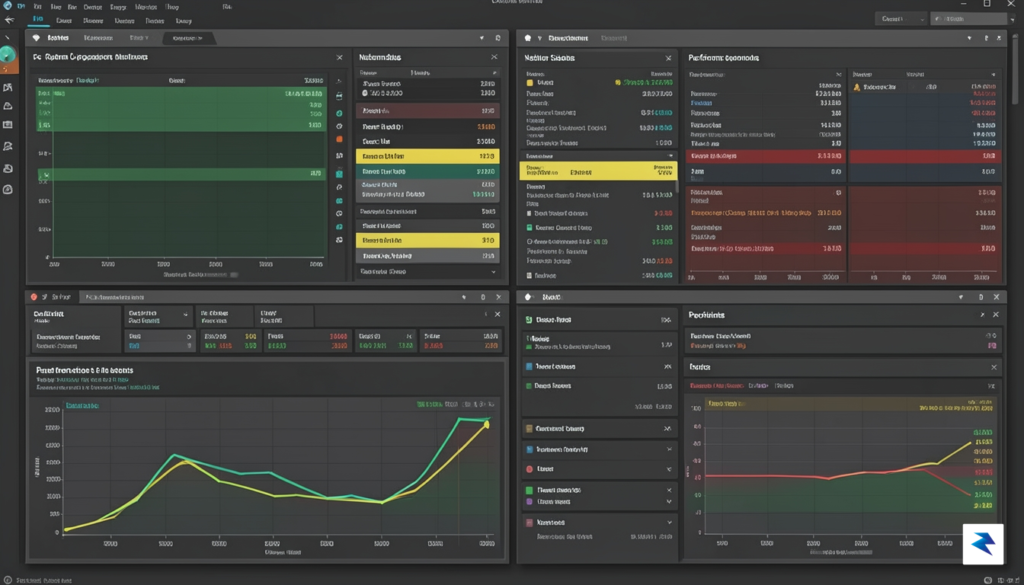
When you launch the interface and watch the global nodes populate with data, the initial flood of IP addresses and response times might seem overwhelming. However, understanding this output is the difference between guessing why a site is down and pinpointing the exact location of a configuration bottleneck. Each entry in the terminal represents a query sent to a specific regional DNS resolver; if you see a mix of old and new IP addresses across the globe, you are witnessing the “propagation phase” in real-time. Inconsistencies between these regions usually indicate that local caching servers are still holding onto legacy TTL (Time-to-Live) values, meaning your recent changes have not yet trickled down to those specific edge nodes.
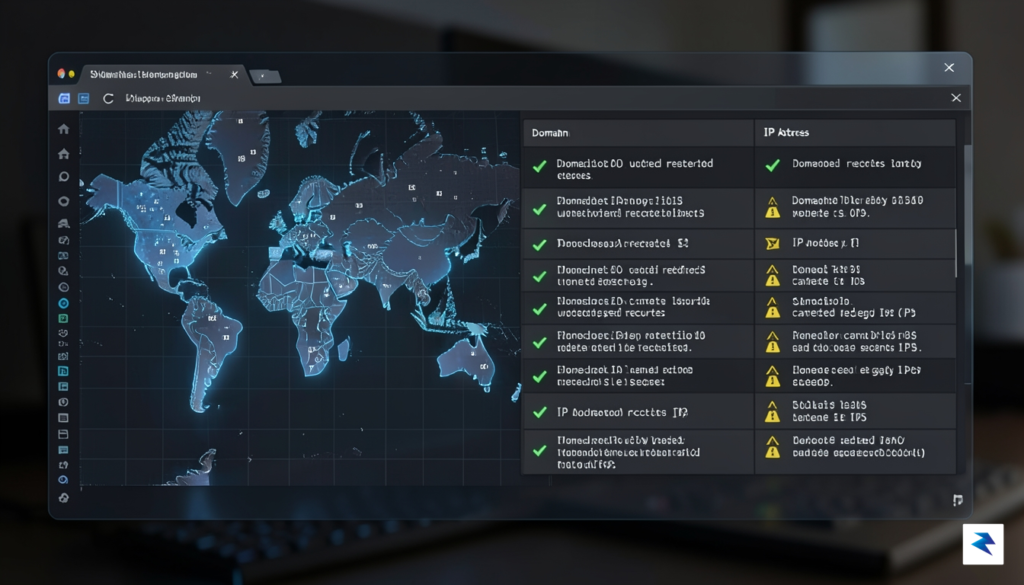
To effectively troubleshoot these discrepancies, you must first distinguish between a legitimate propagation delay and a configuration error. If the majority of the nodes report the updated record but a few stubborn locations remain stuck on the old IP, this is typically a sign of aggressive caching policies at regional ISPs. Conversely, if no nodes across the globe reflect your changes after several hours, it is a strong signal that the update failed at the authoritative nameserver level or that the propagation of your zone file has stalled. By monitoring these patterns, you can determine whether you need to wait out the TTL duration or intervene by force-purging caches where possible.
Key Takeaway: Propagation is rarely instantaneous. Always verify that your authoritative nameservers are correctly incrementing the SOA (Start of Authority) serial number, as this is often the primary trigger for global resolver updates.
When you encounter a “stuck” point in your global rollout, follow this troubleshooting checklist to maintain control over your infrastructure:
NXDOMAIN while others return the correct IP, you likely have a synchronization issue within your DNS provider’s backend cluster.Ultimately, the goal of proactive DNS management is to reduce the “blind spots” that occur during record updates. By keeping your TTL values optimized—lowering them before a major migration and raising them only after you have confirmed global consistency—you minimize the impact on your end users. Regularly monitoring your records through the terminal allows you to catch misconfigurations before they affect your traffic, transforming DNS management from a reactive firefighting exercise into a predictable, well-monitored part of your deployment pipeline.
You must be logged in to post a comment.